I’ve had a good run of winter birding since December, with a couple of new birds for my life list and several more that I did not expect to see this time of the year. Here are some of the highlights.
The day after Christmas, I was sitting around bored and decided to take a drive over to one of my new favorite local birding spots. Cannonball Prairie is a new metropark that we only discovered this past spring. We kept driving past it on the way to Oak Openings and saying, “We really should stop there sometime.”
This (long-delayed; sorry, it’s 2020!) final post in my series about Project BirdMap goes into detail about getting the data, processing it, and using it to build the map. Fair warning: from this point, it’s less birdy and more nerdy.
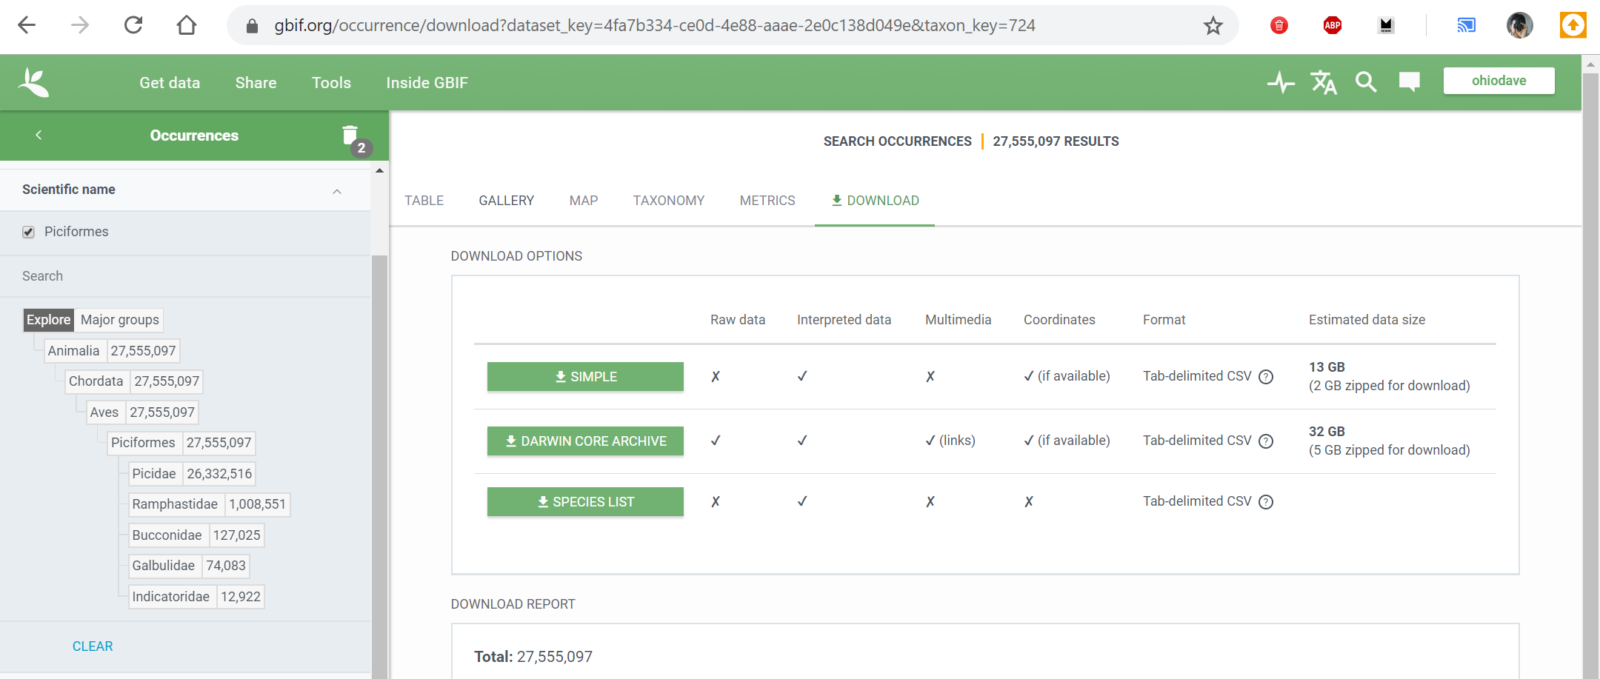
In my Building Project BirdMap post, I talked about EOD, the eBird Observation Dataset. The full dataset is over 300 GB in size, but fortunately I could filter down to just what I needed. For my Woodpeckers map, I used the Scientific name filter and browsed down through the bird taxonomy until I found Piciformes (the woodpecker-like order) and finally Picidae (just woodpeckers).
This took the dataset down to a more manageable 13 GB, but to shrink it a little further I filtered on the observation year and pulled only sightings from 2010 to 2020. I figured that if I wanted to know where to travel in 2020 and beyond, historic observations would be less valuable. This left me with a download of 11 GB, or about 23.6 million bird sightings.
Last time, I shared how my growing interest in birdwatching led me to eBird, an incredible scientific community that’s collecting hundreds of millions of bird sightings and being used to map migration patterns, population trends, and much more. eBird has lots of great reports, but I couldn’t find a way to answer the question I had over the Christmas holidays: where could I go next year to see lots of woodpeckers?
Getting the data
Every living woodpecker species has sightings in eBird with location data, and even range maps; what I couldn’t find was a way to cross-reference these. To answer my question, I’d need to compile a list of every woodpecker species (from some other source, since eBird has no way to browse by family), pull up every range map, note the areas where each bird is most common, and look for overlaps.
I’m the kind of person who, if told it will take 8 hours to do something by hand, and 9 hours to build a tool to do it for you, will build the tool every time. If I could access all that eBird data, I knew I could find a way to create the report I wanted to see.
I started by researching the eBird APIs, but those were mostly useful for recent sightings, and I wanted to search years of records. Fortunately, eBird publishes bulk data exports to a repository called the eBird Observation Dataset (EOD). I was able to browse and filter that data and download a CSV file with all the woodpecker sightings in the last 10 years (more detail on this in the next post). This file contained more than 26 million individual observations, each with species and location info including latitude and longitude. I threw all this into a database, knowing I’d need to search it later.
Making the map
My plan was to take all 26 million observations, aggregate them, crunch some numbers, and then put them on a map. I was familiar with an open-source mapping library called Mapbox GL JS from an earlier project, so it didn’t take long to get a simple map up and running.
eBird’s range maps use a sampling grid, where the world is divided into a grid of squares. Squares where a species appears occasionally are light purple; squares where a species is common are dark purple, and ones where the species has never been seen aren’t colored at all. I wanted to do something similar for my map, but instead of counting occurrences, I wanted to count the number of species reported in that grid square.
To keep my grid simple, I decided to work in degrees of latitude and longitude. I wrote a query to search for all observations in each latitude and longitude box, then count up to the total number of birds, and how many species had been seen there. The output looked something like this:
Mapbox can load data layers over the base map in GeoJSON format so I wrapped my sample grid data in GeoJSON polygons and loaded them up. I set up rules to color-code the grid (a technique called a chloropleth): the more species in a square, the darker the orange. After some tweaking, the result looked like this:
Using this map, I could finally answer my original question. If I want to see lots of different woodpeckers on a single trip, inland California (especially the area east of Bakersfield), the Arizona / New Mexico border region, southwestern Utah, and central and eastern Oregon all look like great places to start! Each of these regions boasts at least 12 different woodpecker species.
Zooming out to look at the rest of the world, I found that northwestern South America and Southeast Asia are the world’s woodpecker hotspots. Now I know that someday I’d love to visit Kaeng Krachan National Park in Thailand to see the beautiful Greater Flameback and the world’s largest woodpecker, the Great Slaty.
Once I had the basic map in place, I started adding bells and whistles. First, I added a detail bar on the right to show information about the total number of sightings and the sightings for each species within each grid square. Since I had the eBird species code, I could also link to eBird’s species description page for each, and even show a list of recent sightings in that area.
Next, I added was the ability to filter the map to show one species at a time. Technically eBird already has this (and since their data isn’t filtered to the last 10 years they show more sightings), but it was neat to be able to quickly flip between species and see what parts of the world they call home.
The last thing I added was the ability to show range overlaps. In the screenshot above, you can see the parts of Asia where you might find both a Greater Flameback and a Great Slaty Woodpecker (including Kaeng Krachan National Park). This will come in handy in the future if I’m looking to plan a trip to see specific species, instead of just the larger number of species possible.
Taking it further
By the time I had the woodpecker map mostly done, I was already thinking about mapping different kinds of birds. After woodpeckers, my next favorite family is the corvids (crows, ravens, magpies, and jays), so I set out to repeat the process.
After I’d done it once, setting up a new family map turned out to be super easy. The worst part was waiting for gigabytes of data to import into my database and waiting for my sampling script to re-run. In the couple of weeks since I started Project BirdMap, I’ve created versions a total of 7 bird families:
And I’ve already got plans for more! In Part 3, I’ll dive into the technical details behind Project BirdMap and some of the issues I solved along the way.
It’s been about a year now since I really got into birds.
I’ve always been interested by birds, always enjoyed taking pictures of them, even knew the names and general appearance of some kinds of birds, from my days as a Boy Scout. But after our trip to Hawaii, where there were so many spectacular birds just milling about everywhere, I started wanting to know: what is that bird I see, and what’s his story?
When I got back, I went out and picked up a field guide called Birds of North America: Eastern Region and started keeping track of what I saw. By mid-year, my life list was over 100 species and we were already planning our vacations to take us places where we could see new and exciting birds. I started out using the Audubon app to keep track of my bird sightings. It’s a great app, but Audubon only covers the American Birding Area, which is basically the continental US, Canada, and Alaska. None of my Hawaiian sightings counted, nor did the other birds I was able to identify from photos from ten years of trips to Central and South America, Europe, and North Africa.
Enter eBird
Somewhere along the way I found eBird, which is the global gold standard for bird data collection. Thousands of amateur and professional birdwatchers submit to eBird every day, and it’s probably the best resource in the world for knowing where birds can be found. I started sending all my lists to eBird, and I even had a rare sighting in June 2019. For a few days, an odd-looking dove kept coming to my feeder. It was bigger and lighter than the usual Mourning Doves, with a distinctive black ring on the back of its neck. Based on a picture in my field guide I recorded it as a Eurasian Collared-Dove. A week or two later, I got an email from someone on the eBird rare bird verification team, asking me for more information. The eBird mod asked me if I had photos or detailed notes to share. Unfortunately I didn’t get a picture, and based on what I could remember, we couldn’t positively identify it as either a Eurasian Collared-Dove or the very similar African Collared-Dove. We left the sighting unconfirmed, but I was happy to learn and interact with a real expert.
Spark Birds
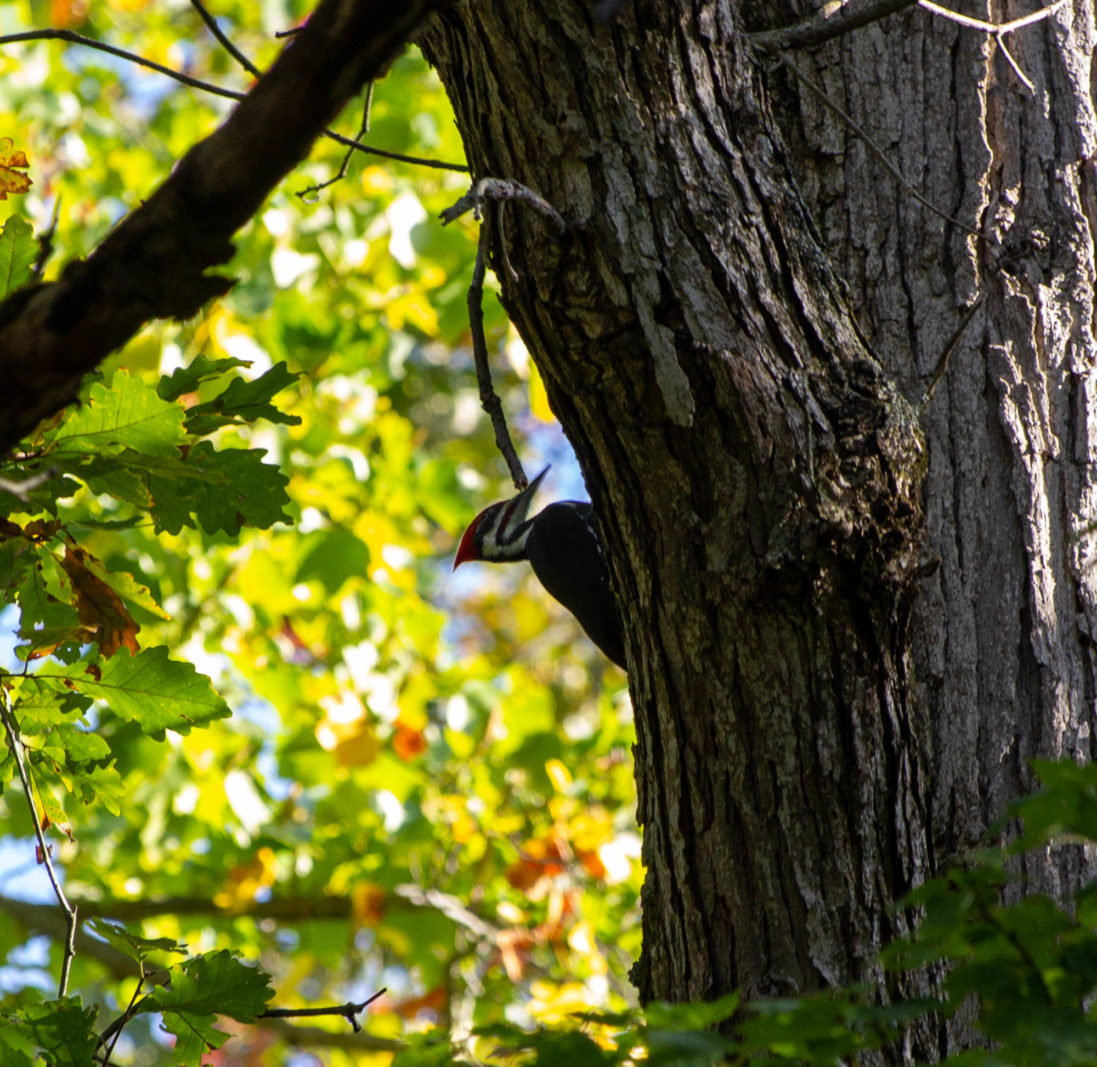
Bird people talk about something called a “spark bird”: a bird that gets you really excited and makes you want to see and learn more. I had two in 2019: the first was a Pileated Woodpecker that I saw at Oak Openings. These giant woodpeckers with their raucous laughing calls were at the top of my “must see” list, so I checked eBird to find where they were hanging out nearby. One Saturday morning in May, Michelle and I went out early, hoping to get lucky, and we weren’t disappointed. A little way up the Silver Trail, In a meadow full of old, tall trees, we saw a pair of Pileateds calling and flying around, apparently working on their nest. We stayed and watched them for ten minutes, and they were just as big and bright and loud as I had hoped.
Pileated Woodpecker at Oak Openings
My second “must see” bird was a Steller’s Jay. Essentially the west-coast version of our Blue Jay, the Steller’s was my obsession on our summer trip to British Columbia. We stopped in at the local Wild Birds Unlimited and the ladies working there frowned. Maybe in the winter they’d come to feeders, they said, but in the summer they were rather scarce. We stayed in Vancouver for two days and saw some very good birds, but no Steller’s Jays. On August 4th, headed for Vancouver Island and Pacific Rim National Park on the west coast. We took some amazing walks through old-growth rainforest and saw a raven the size of a small eagle, but still no jays.
That night, as Michelle was driving back to our hotel along the Pacific Rim Highway, I was looking idly out the window when I caught a flash of deep blue on the side of the road. I shouted “Steller’s Jay!” so loud that Michelle might have had a minor heart attack, but there was traffic behind us so we couldn’t stop and go back.
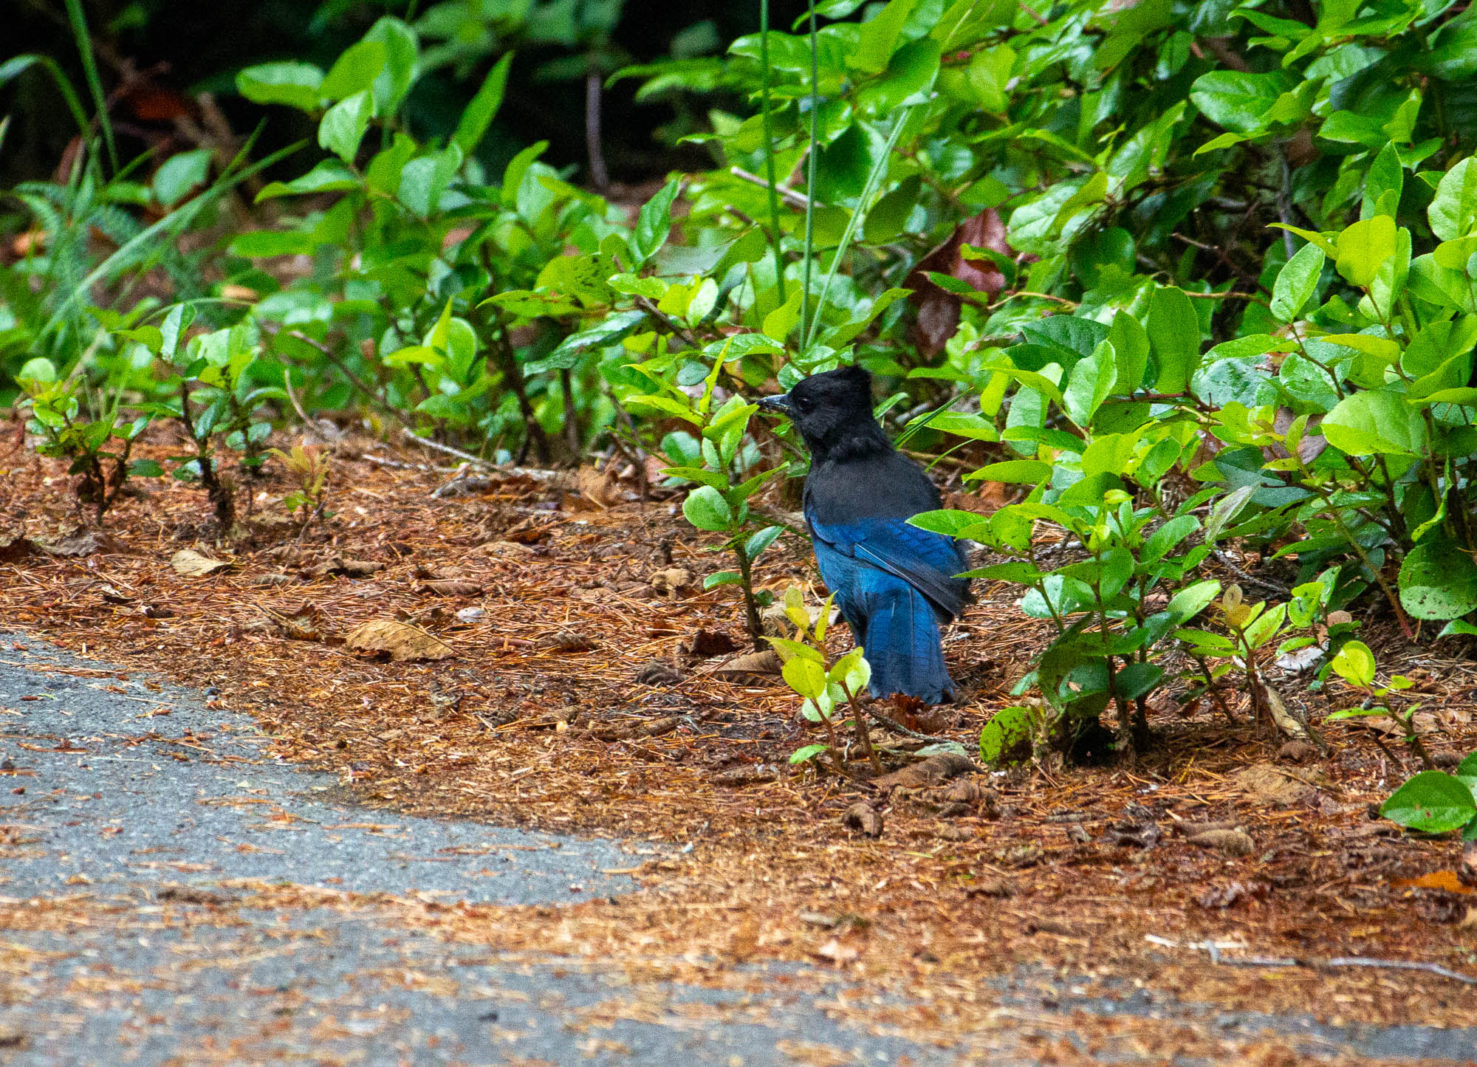
The next morning, we drove to the Shorepine Bog area of Pacific Rim National Park, and there in the parking lot, hopping between the dumpsters, was our first “official” Steller’s Jay.
Steller’s Jay at Shorepine Bog, Pacific Rim National Park
Later on we found that Ucluelet, where we were staying, was full of Steller’s Jays. Over the next three days we heard and saw many more, including a friendly bird named “Nugget” at North Island Wildlife Recovery Centre, but none of these would ever be as exciting as that first elusive bird.
A question, and an idea
This brings us to the end of 2019. After meeting my two spark birds, I’d been doing a ton of reading and learning and planning more bird-related adventures. Over the holiday break, I started to wonder where in the country I could go to see lots of different kinds of woodpeckers. I’ve seen my Pileated, and my backyard is regularly visited by Downy and Red-Bellied Woodpeckers, but there are so many more: Acorn Woodpeckers, Ladder-backed Woodpeckers, Yellow-bellied Sapsuckers, and literally dozens more in North America alone.
eBird didn’t have the answers I was looking for. I could pull up a species and see its range, and I could pull up an area of the country and see the local birding hotspots and what had been found there recently, but I couldn’t find a tool to tell me what I wanted to know: what parts of the US are especially rich in woodpeckers?
So I thought to myself: I’m a developer, and eBird’s data is open-source. If I can’t find a tool, I’ll make one. In my next post, I’ll introduce my creation: Project BirdMap, and how I made it.